
Regression analysis is a powerful statistical tool data analysts use to understand relationships between variables and make predictions. Linear and logistic regression are two of the most widely used techniques in regression analysis. These models are essential for predicting continuous variables (in the case of linear regression) or categorical outcomes (in the case of logistic regression). As businesses strive to make data-driven decisions, learning how to implement regression analysis through SQL is a critical skill. Enrolling in a data analyst course in Pune can provide you with the foundation to understand and apply these methods efficiently.
What is Regression Analysis?
Regression analysis is a statistical method used for modelling the relationship between a dependent variable and one or more independent variables. The goal is to establish a mathematical model that can predict the dependent variable based on the values of the independent variables. Using this technique, analysts can identify trends, relationships, and patterns within data that might be missed.
SQL can perform regression analysis on data stored in relational databases. Its flexibility and ability to handle large datasets make it an excellent tool for implementing both linear and logistic regression models. A data analyst course can help those looking to build a solid understanding of regression analysis using SQL develop the necessary skills to perform these tasks.
Linear Regression: Modeling Continuous Variables
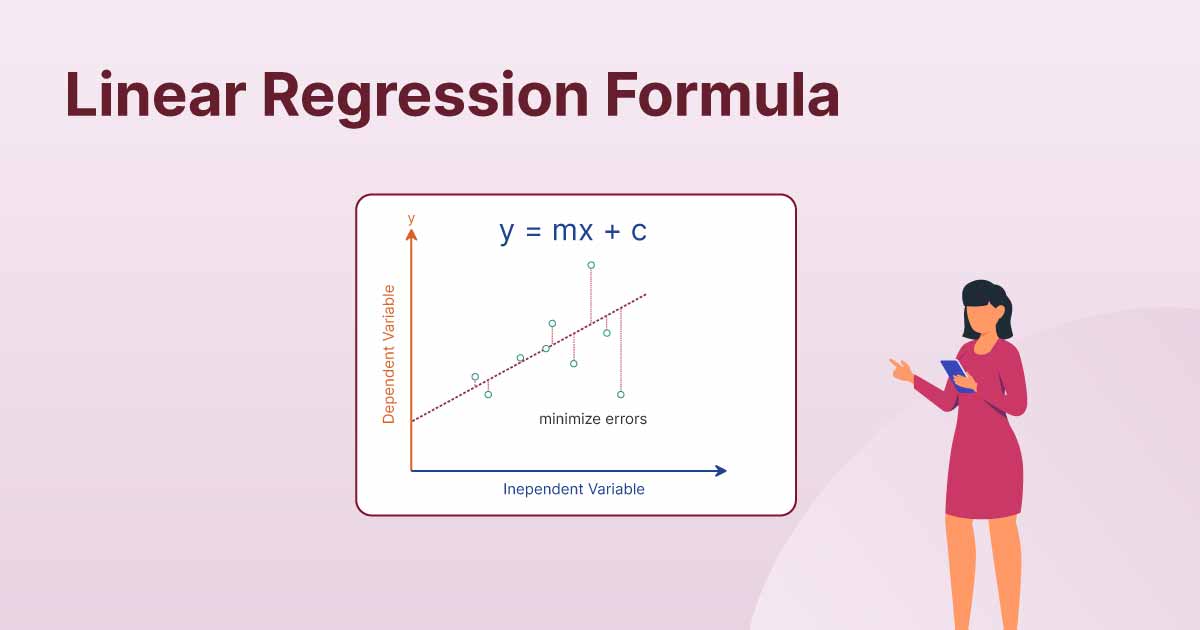
Linear regression is a fundamental technique to model the relationship between a continuous dependent variable and one or more independent variables. The model assumes that there is a linear relationship between the variables, which can be expressed in the following formula:
Y=β0+β1X1+β2X2+⋯+βnXn+ϵY = \beta_0 + \beta_1 X_1 + \beta_2 X_2 + \cdots + \beta_n X_n + \epsilonY=β0+β1X1+β2X2+⋯+βnXn+ϵ
Where:
- YYY is the dependent variable
- β0\beta_0β0 is the intercept
- β1,β2,…,βn\beta_1, \beta_2, \dots, \beta_nβ1,β2,…,βn are the coefficients of the independent variables
- X1,X2,…,XnX_1, X_2, \dots, X_nX1,X2,…,Xn are the independent variables
- ϵ\epsilonϵ is the error term
In SQL, implementing linear regression typically requires aggregation functions and mathematical operations to calculate the necessary coefficients. While SQL does not provide built-in functions for regression analysis, you can use a combination of SQL queries and custom functions to implement linear regression models. For example, to calculate the slope (β1\beta_1β1) and intercept (β0\beta_0β0), you need to calculate the covariance and variance of the independent variable and the dependent variable.
Enrolling in a data analyst course can give you the hands-on experience needed to work with large datasets and effectively apply linear regression models.
Steps for Implementing Linear Regression in SQL:
- Calculate the Mean Values: Begin by calculating the mean of both the dependent variable (Y) and the independent variable (X). This is typically done using the AVG() function in SQL.
- Calculate the Covariance and Variance: You can use SQL’s mathematical functions to compute the covariance between the dependent and independent variables and the variance of the independent variable.
- Calculate the Coefficients: Use the covariance and variance values to calculate the regression coefficients (slope and intercept).
- Make Predictions: Once the model is built, you can use the regression coefficients to make predictions about the dependent variable based on new values of the independent variables.
You can effectively use SQL for linear regression analysis by mastering these techniques. With a data analyst course, you can refine and apply your skills to real-world scenarios, improving your career prospects.
Logistic Regression: Modeling Categorical Variables
Logistic regression is a variation of linear regression used when the dependent variable is categorical rather than continuous. It is commonly used for binary classification problems, where the output is one of two possible outcomes, such as “yes” or “no,” “success” or “failure,” etc. Logistic regression uses a logistic function to model the probability of the dependent variable falling into one of the two categories.
The following formula can represent the logistic regression model:
P(Y=1∣X)=11+e−(β0+β1X1+⋯+βnXn)P(Y = 1|X) = \frac{1}{1 + e^{-(\beta_0 + \beta_1 X_1 + \cdots + \beta_n X_n)}}P(Y=1∣X)=1+e−(β0+β1X1+⋯+βnXn)1
Where:
- P(Y=1∣X)P(Y = 1|X)P(Y=1∣X) is the probability that the dependent variable equals one given the independent variables XXX.
- β0\beta_0β0 is the intercept, and β1,…,βn\beta_1, \dots, \beta_nβ1,…,βn are the coefficients for the independent variables.
- eee is Euler’s number, which is approximately 2.718.
Implementing logistic regression in SQL is more complex than linear regression because the model involves a non-linear transformation of the independent variables. However, you can perform logistic regression analysis to predict categorical outcomes by combining SQL with mathematical functions and stored procedures.
For example, to apply logistic regression in SQL, you would typically use an iterative approach, repeatedly adjusting the coefficients until the model converges on the best-fit values. Optimisation techniques like gradient descent, a common method for minimising the error in the model, can be used.
By taking a data analyst course in Pune, you can gain in-depth knowledge of how to perform logistic regression analysis and other advanced data analysis techniques.
Steps for Implementing Logistic Regression in SQL:
- Data Preprocessing: Prepare your data by encoding categorical variables into numerical values (for example, converting “yes” and “no” into 1 and 0). You may also need to normalise the data to improve model performance.
- Calculate the Logistic Function: Apply the logistic function to the linear combination of the independent variables and their coefficients.
- Estimate Coefficients: Use iterative methods, such as gradient descent, to estimate the optimal values of the regression coefficients.
- Make Predictions: Once the model is built, you can use it to predict the probability of the dependent variable falling into one of the categories and make classification decisions based on a chosen threshold.
- Evaluate the Model: Calculate metrics like accuracy, precision, recall, and the ROC curve to assess the logistic regression model’s performance.
By learning these steps, you can confidently implement logistic regression in SQL, enabling you to tackle classification problems effectively. A data analytics course in Pune can guide you through these steps, helping you refine your skills and apply them in practical situations.
Conclusion
Regression analysis, both linear and logistic, is a powerful technique for making predictions and understanding relationships between variables. SQL provides a solid foundation for implementing these models, although it requires combining SQL queries with mathematical functions. Whether you’re predicting continuous variables with linear regression or making classifications with logistic regression, SQL can be an invaluable tool in your data analysis toolkit.
By taking a data analyst course in Pune, you can learn how to implement these regression models effectively, gaining hands-on experience with real-world datasets. With this knowledge, you’ll be well-equipped to apply regression analysis in various business and research contexts, helping you make data-driven decisions and predictions.
Business Name: ExcelR – Data Science, Data Analytics Course Training in Pune
Address: 101 A ,1st Floor, Siddh Icon, Baner Rd, opposite Lane To Royal Enfield Showroom, beside Asian Box Restaurant, Baner, Pune, Maharashtra 411045
Phone Number: 098809 13504
Email Id: enquiry@excelr.com